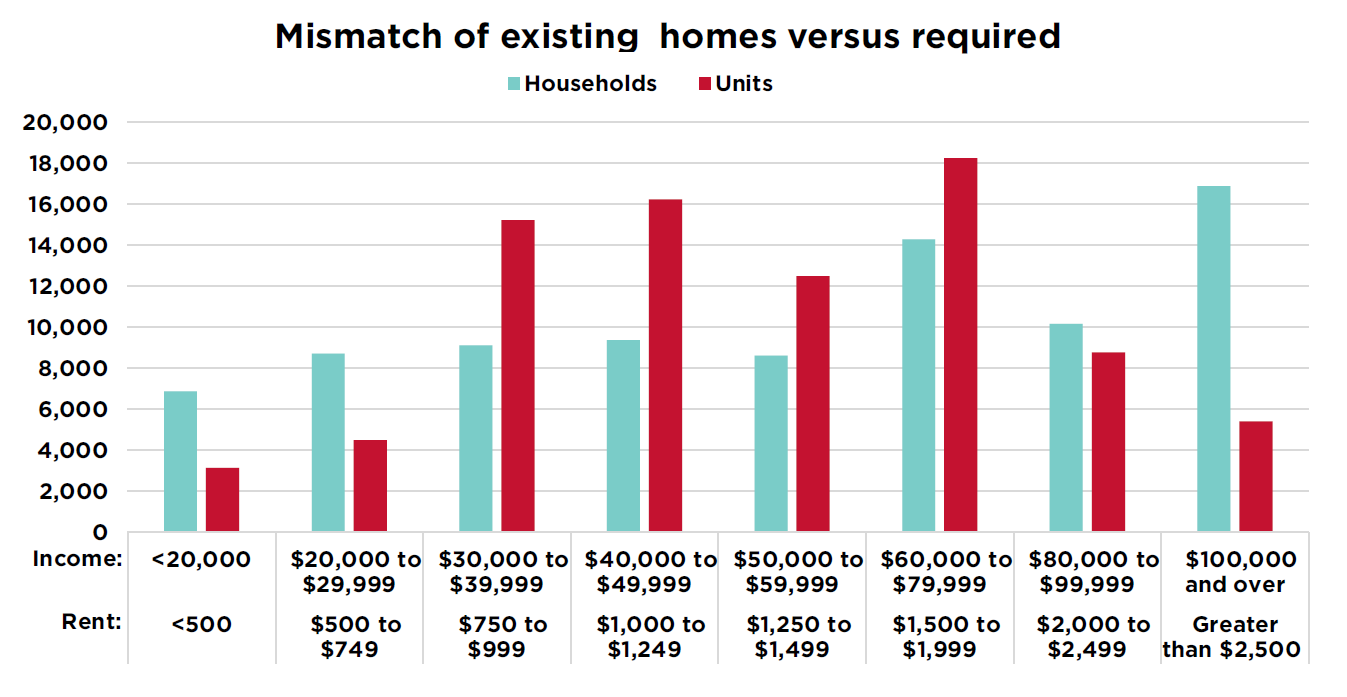
Supply of rental units compared to income range
One way of examining adequate affordable rental housing supply is to compare the distribution of households by income range to the number of units in a corresponding affordable rent range using 30% of annual income spent on housing costs as the rule. For example, households with annual incomes of $20,000 to $30,000 are compared to the number of units that rent for $500 to $750 per month.
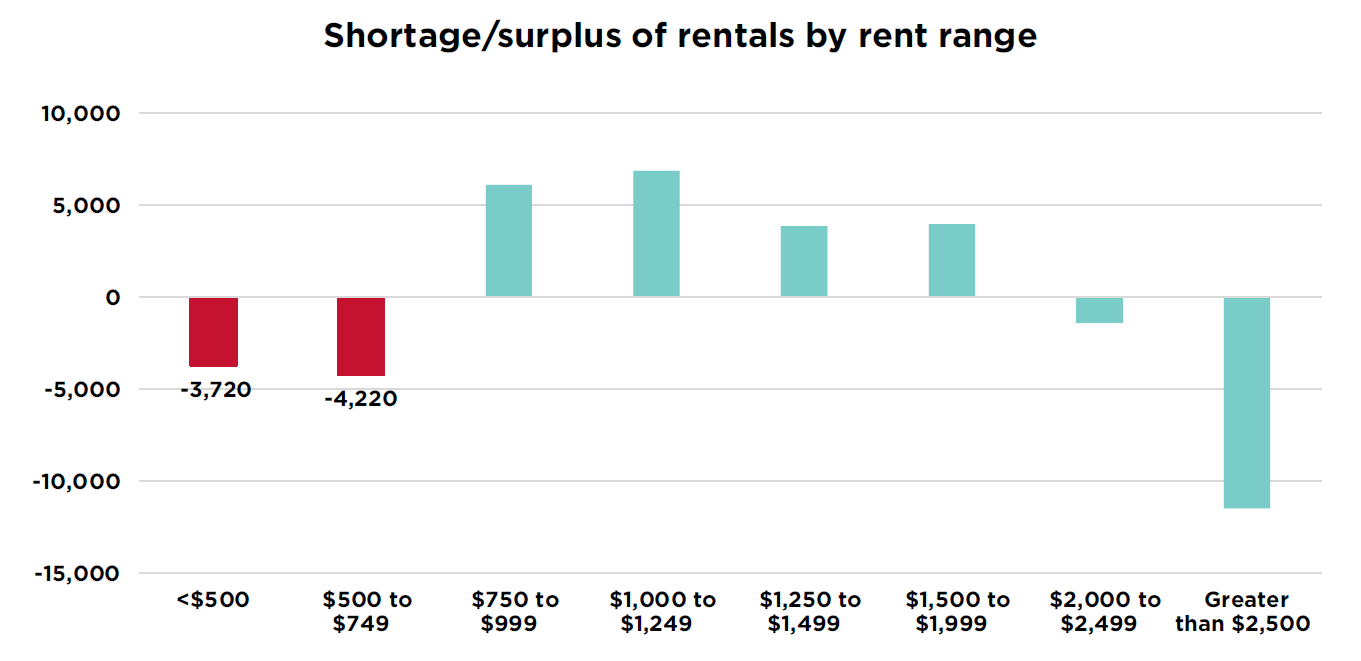
As shown in the next two charts, based on census data, in 2021 there was a shortfall of almost 8,000 units under $750 — a rent range affordable for those with incomes under $30,000 — influenced by the erosion of units as noted above. The lack of lower-rent units means that many households with incomes below $30,000 live in units renting above $750, and many above $1,000 — well over the 30% affordability benchmark.
While these charts show, in theory, a shortage in units over $2,500, it also reflects a substantial number of higher-income renters who occupy units for under $2,000 per month. The large number of higher-income renters might also create an incentive to build luxury rental units or detached homes.
Source: Canada Mortgage and Housing Corporation, Special Request.